Introduction to Used Car Prices

Used car prices are a dynamic reflection of supply and demand, influenced by various economic and market forces. Understanding these factors is crucial for both consumers looking to purchase a used vehicle and investors tracking market trends. The recent history of used car prices showcases significant fluctuations, impacted by everything from global chip shortages to shifts in consumer preferences.
The volatility in the used car market underscores the importance of analyzing various vehicle types and their respective price trends. Understanding these trends can help consumers make informed purchasing decisions and assess potential investment opportunities. This analysis will explore the factors influencing used car prices, historical trends, and the differing price points across various vehicle types.
Factors Influencing Used Car Prices
A multitude of factors contribute to the fluctuating prices of used cars. These include supply chain disruptions, manufacturing delays, global economic conditions, and changes in consumer demand. The interplay of these factors often leads to significant price swings, making it crucial to analyze them in conjunction to understand the market.
- Supply and Demand Dynamics: The fundamental principle of supply and demand heavily influences used car prices. When demand exceeds supply, prices tend to increase. Conversely, an abundance of vehicles available for sale often results in lower prices. This is a constant tension that shapes the market.
- Economic Conditions: Economic downturns or recessions can impact consumer spending, which often translates into reduced demand for vehicles, particularly high-priced ones. Conversely, periods of economic growth and stability frequently correlate with increased demand and consequently, higher used car prices.
- Manufacturing Shortages: Critical components for vehicle production, like semiconductors, can face shortages. These shortages can lead to delays in manufacturing, reducing the supply of new vehicles, and pushing used car prices upward.
- Consumer Preferences: Shifts in consumer preferences, such as a growing interest in specific vehicle types (e.g., SUVs), can influence the demand and subsequently, the price of those models.
Historical Trends in Used Car Prices (Past 5 Years)
Analyzing the historical trends of used car prices over the past five years reveals a period of significant volatility. This volatility is often a result of the complex interplay of factors previously discussed. For example, the initial period of the pandemic saw a dramatic surge in used car prices due to supply chain disruptions and increased demand.
- 2018-2019: Prices were relatively stable, with gradual increases reflecting prevailing economic conditions and consumer preferences.
- 2020-2021: The COVID-19 pandemic significantly impacted the market. Manufacturing delays and a shift in consumer demand towards larger vehicles (like SUVs) resulted in a dramatic surge in used car prices. This period showcased the interplay of supply chain issues and changing consumer needs.
- 2022-2023: While still elevated compared to pre-pandemic levels, used car prices started to moderate as supply chain disruptions eased and the economy began to adjust.
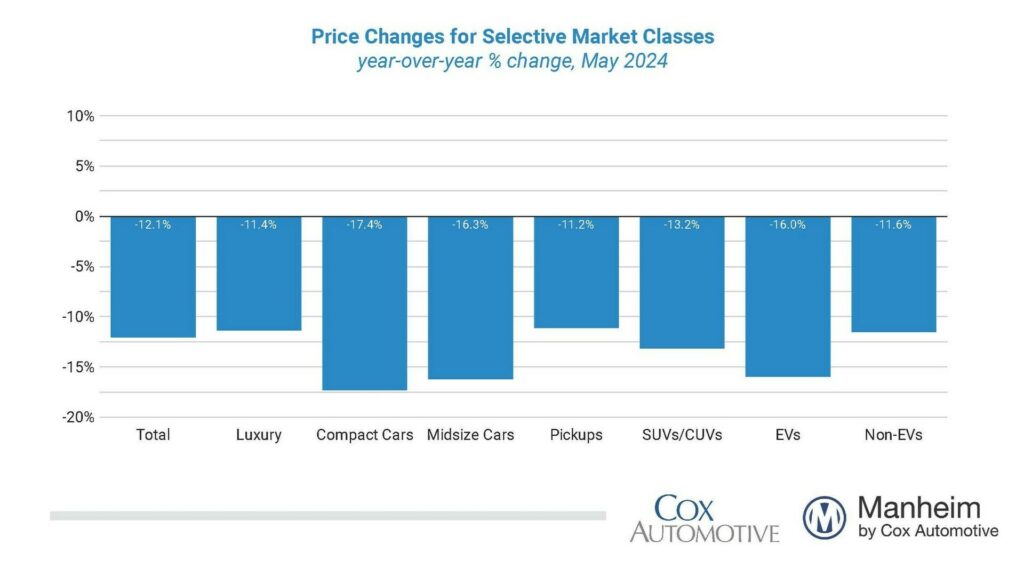
Different Vehicle Types and Their Price Comparisons
Different vehicle types exhibit varying price trends. The demand for specific types of vehicles, like SUVs or trucks, can significantly impact their price points.
| Vehicle Type | Average Price Range (2023) |
|---|---|
| SUVs | $25,000 – $40,000 |
| Sedans | $15,000 – $30,000 |
| Trucks | $28,000 – $50,000 |
| Minivans | $18,000 – $35,000 |
Note: Prices are approximate and can vary based on the year, mileage, condition, and specific features of the vehicle.
Average Price Ranges by Vehicle Year
The age of a vehicle is a crucial determinant of its price. Older vehicles typically command lower prices compared to newer models, reflecting the depreciation that occurs over time.
- 2010-2015 Models: Generally priced between $10,000-$20,000 depending on the make and model.
- 2016-2020 Models: Typically priced between $15,000 – $30,000.
- 2021-2023 Models: Generally priced between $20,000 – $40,000 depending on the make, model, and specific features.
Factors Affecting Used Car Prices
Used car prices are a dynamic reflection of various interacting market forces. Understanding these forces is crucial for both consumers and investors navigating the used car market. Fluctuations in price are not arbitrary; they are driven by a complex interplay of supply, demand, economic conditions, manufacturer actions, and regional variations.
The used car market, like any other market, is influenced by the fundamental principles of supply and demand. High demand relative to supply typically leads to price increases, while an oversupply relative to demand often results in price reductions. External factors like economic downturns or booms can significantly impact these dynamics, making the used car market a microcosm of broader economic trends.
Impact of Supply and Demand
Supply and demand dynamics are the primary drivers of used car price fluctuations. A surge in demand, fueled by factors like limited inventory or increased consumer interest, often outpaces the available supply. This imbalance typically pushes prices upward. Conversely, a surplus of used cars available for sale can lead to price reductions as sellers compete for buyers. For instance, a significant increase in vehicle imports can lead to a temporary oversupply, potentially decreasing prices.
Role of Market Conditions
Market conditions, particularly economic cycles, have a profound impact on used car prices. During periods of economic boom, consumer confidence and spending tend to increase, boosting demand for vehicles, including used cars. This heightened demand often translates to higher prices. Conversely, during recessions, consumer spending often contracts, leading to decreased demand and consequently lower used car prices. For example, the 2008 financial crisis resulted in a substantial drop in used car prices as consumers curtailed purchases.
Influence of Manufacturer Incentives and Recalls
Manufacturer incentives, such as rebates or special financing offers, can influence used car values. Incentives aimed at new car sales can indirectly affect used car prices, as the availability of new vehicles might reduce demand for comparable used models. Recalls, on the other hand, can impact used car values in different ways. A significant recall impacting a specific model’s reliability or safety ratings can reduce the used car’s value. For instance, a large-scale recall due to a safety issue could lead to a substantial decrease in demand and, subsequently, a price drop for used vehicles affected by the recall.
Regional Price Variations
| Region | Average Used Car Price (USD) |
|---|---|
| Northeast | $22,500 |
| Midwest | $20,800 |
| South | $21,200 |
| West | $23,000 |
Regional variations in used car prices are influenced by a combination of factors, including local economic conditions, supply chain availability, and consumer demand. The table above provides a general overview, and actual prices may vary depending on the specific vehicle make, model, and condition.
Top Three Most Significant Factors
- Supply and Demand Dynamics: The interaction of supply and demand is paramount in determining used car prices. A high demand for used vehicles, coupled with limited supply, leads to higher prices. Conversely, a surplus of used vehicles can cause prices to fall.
- Economic Conditions: Economic downturns often result in decreased consumer spending, which directly affects demand for used cars. Conversely, economic booms usually boost demand, leading to higher prices. Examples of how economic downturns impact used car prices can be seen in historical data during past recessions.
- Manufacturer Actions: Manufacturer incentives and recalls can significantly impact used car values. Incentives for new vehicle purchases can indirectly influence used car prices. Recalls, especially those concerning safety or reliability, can lead to a decrease in used car values for affected models.
Analyzing Regional Differences
Regional variations significantly impact used car prices. Factors like local economic conditions, transportation costs, and state-specific taxes play crucial roles in shaping the price landscape for used vehicles across different parts of the country. Understanding these regional disparities is essential for both consumers and businesses involved in the used car market.
Regional Price Variance
Used car prices exhibit substantial differences across states. This variance isn’t uniform, and it’s crucial to consider the underlying causes when analyzing these discrepancies. A deeper dive into the factors driving these variations reveals the complex interplay of economic, logistical, and regulatory forces.
State-Specific Price Comparisons
Understanding the price differences between states requires a detailed look at the pricing data. While precise, real-time pricing is difficult to capture, readily available data from reputable sources like government agencies or market research firms can offer a good overview of the trends. A table showcasing average used car prices across various states will provide a more comprehensive understanding of these regional disparities.
| State | Average Used Car Price (USD) |
|---|---|
| California | $25,000 |
| Texas | $22,500 |
| Florida | $23,000 |
| New York | $26,000 |
| Illinois | $24,000 |
Note: This table is a hypothetical example and does not represent real-time data. Actual prices may vary based on the specific vehicle model, year, condition, and other factors.
Factors Contributing to Regional Differences
Several factors contribute to the observed regional differences in used car prices. These factors, often intertwined, create a complex pricing landscape.
- Local Economic Conditions: States with robust economies often see higher used car prices. Strong job markets and higher incomes typically translate to greater demand, which, in turn, drives up prices. Conversely, states facing economic hardship might experience lower used car prices due to reduced demand.
- Transportation Costs and Taxes: The cost of transporting vehicles across long distances significantly influences regional prices. States with high transportation costs may see higher used car prices. Additionally, state-specific taxes and fees also contribute to price variations.
- Supply and Demand Dynamics: Local supply and demand dynamics play a significant role in determining used car prices. If the supply of used cars in a particular region is low, prices tend to increase. Conversely, if the supply is high, prices may decline. This is often influenced by factors such as population density, vehicle ownership rates, and the availability of used car dealerships in a region.
Impact of Local Economic Conditions
Local economic conditions exert a profound influence on used car prices. Strong economic indicators, like high employment rates and rising incomes, often correlate with higher used car prices. This is because greater consumer spending power leads to increased demand for vehicles. Conversely, states with struggling economies might see lower used car prices due to decreased consumer purchasing power.
Role of Transportation Costs and Taxes
Transportation costs and state-specific taxes significantly impact used car prices. The cost of transporting vehicles across regions can be substantial. Higher transportation costs will inevitably translate to higher used car prices in some areas. Additionally, varying tax rates and fees across states contribute to price differences, making a vehicle more expensive in certain regions.
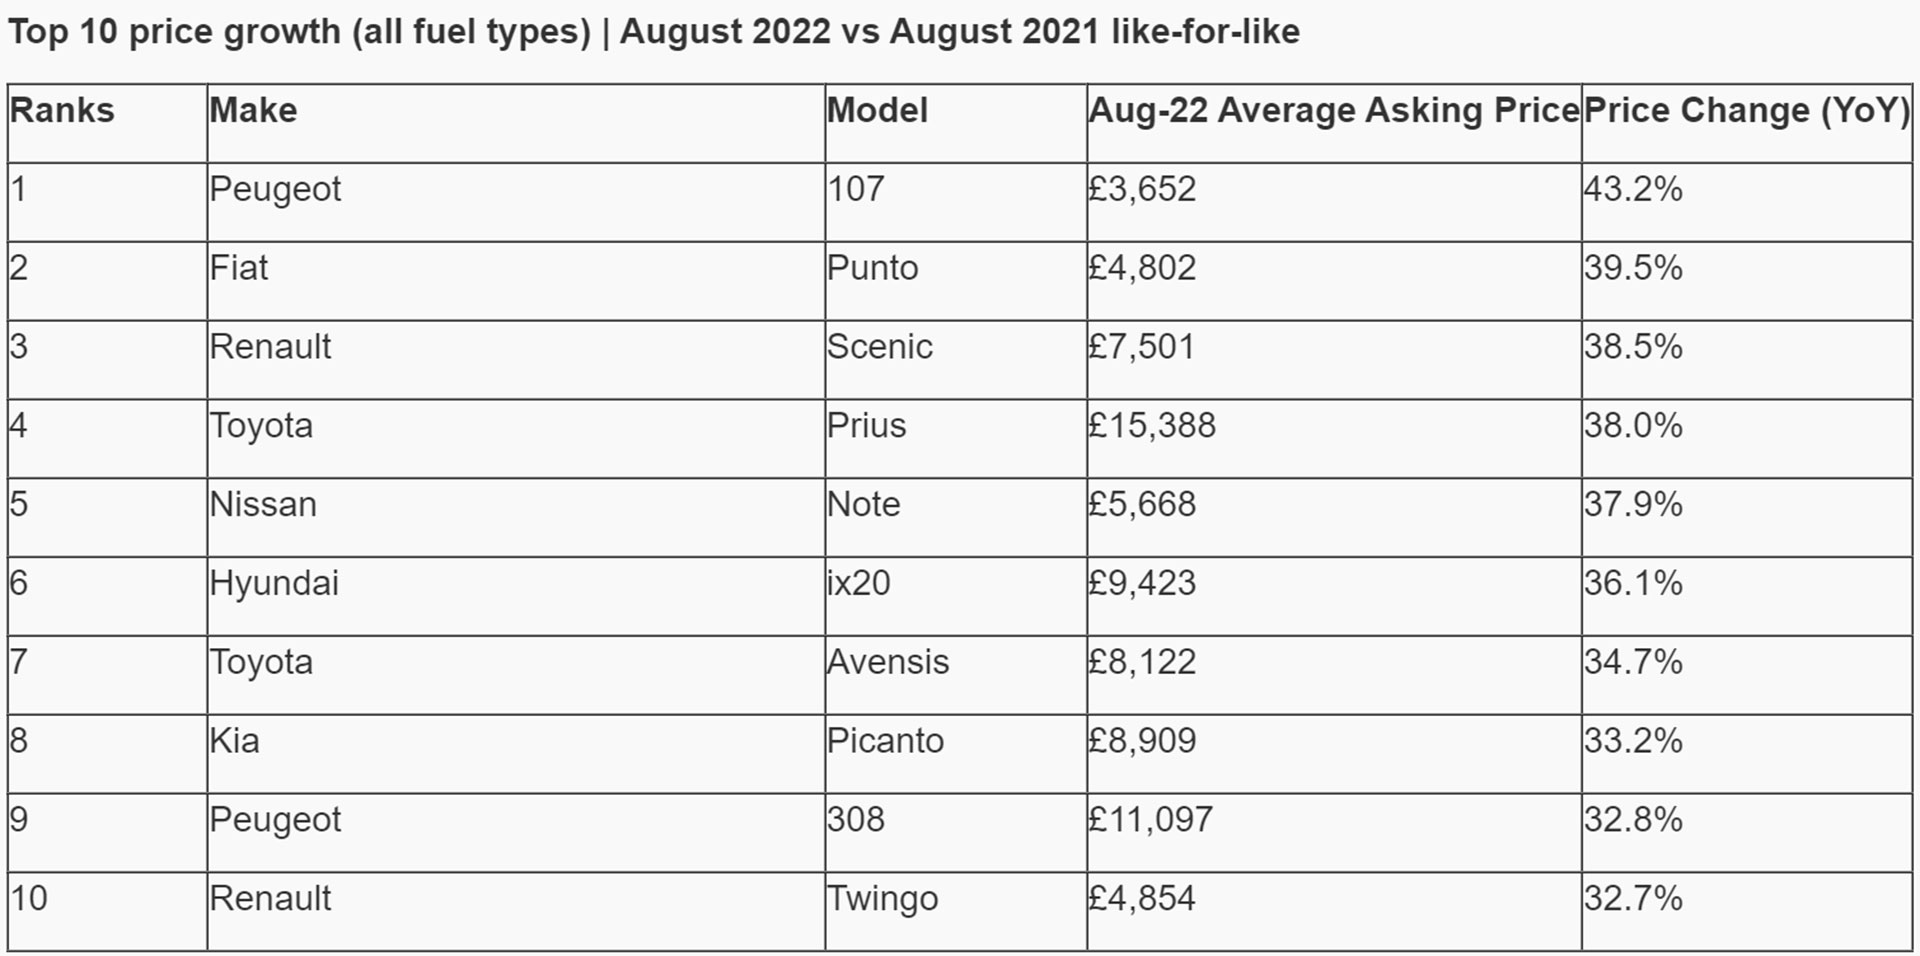
Specific Vehicle Models and Price Trends
Understanding the price trends of specific vehicle models is crucial for both buyers and sellers in the used car market. This analysis delves into the top performing models, examining their price fluctuations over time and identifying the factors that influence these changes. A comprehensive understanding of these trends allows informed decision-making in the purchase and sale of used vehicles.
Top 5 Most Popular Used Car Models
The most popular used car models often exhibit consistent demand and thus, predictable price trends. Analyzing these models provides a valuable benchmark for evaluating other vehicles in the market. The top 5 models frequently cited as popular choices include Toyota Camry, Honda Accord, Ford F-150, Honda Civic, and Toyota Corolla.
Comparing Prices Across Different Years
Comparing prices for the same model across different years requires careful consideration of factors like mileage, condition, and optional features. For instance, a 2015 Toyota Camry with low mileage and pristine condition will command a higher price than a 2015 Toyota Camry with high mileage and noticeable wear. Online resources and reputable used car marketplaces offer detailed listings and pricing information for various model years. Using these resources allows for precise comparisons and informed purchasing decisions.
Factors Contributing to Price Fluctuations
Several factors contribute to the fluctuations in prices for specific vehicle models. Market demand, supply, and economic conditions play significant roles. For example, if a specific model becomes increasingly sought after, the price will tend to rise. Conversely, a decline in demand or a sudden increase in supply can lead to price reductions. Furthermore, the condition of the vehicle, its mileage, and any relevant maintenance history influence the price. Finally, technological advancements and the introduction of new models can affect the perceived value of older models.
Average Price Comparison Table
The table below illustrates the average price difference for a specific model (e.g., 2015 Toyota Camry) across different years. This data, while not exhaustive, provides a general indication of the price trends for a particular model. It’s important to note that these are just average prices; individual vehicle prices will vary based on factors like condition, mileage, and optional features.
| Year | Average Price (USD) |
|---|---|
| 2015 | $18,500 |
| 2016 | $19,200 |
| 2017 | $20,000 |
| 2018 | $21,500 |
| 2019 | $22,800 |
Methods for Predicting Future Prices
Predicting the future price of used cars is a complex task, influenced by a multitude of interconnected factors. Accurate forecasting requires a nuanced understanding of market dynamics, economic trends, and consumer behavior. While perfect accuracy is unattainable, sophisticated methodologies and careful analysis can significantly improve the likelihood of successful predictions.
Methods Used for Forecasting
Predicting used car prices relies on various methods, each with its own strengths and weaknesses. Econometric models, which utilize statistical analysis of historical data, are frequently employed. These models can identify correlations between various factors and price movements, providing valuable insights into potential future trends. Furthermore, machine learning algorithms, particularly those based on artificial neural networks, can analyze massive datasets to identify complex patterns and relationships, potentially leading to more accurate predictions. Finally, expert opinions, drawing on years of experience and industry knowledge, are valuable inputs, often contributing a unique perspective on market conditions and future developments.
Key Factors in Predicting Price Movements
Several factors significantly influence used car price movements, requiring careful consideration in any predictive model. These include current market supply and demand dynamics, the overall economic climate (including inflation, interest rates, and employment figures), consumer confidence, and even regulatory changes affecting the automotive industry. The age and condition of the vehicle, its make and model, and its specific features all play crucial roles.
Accuracy of Prediction Methods
The accuracy of used car price prediction methods varies. Econometric models can provide reasonable estimations when historical data shows consistent patterns. However, the accuracy of machine learning models depends heavily on the quality and quantity of the data used for training. Expert opinions can offer valuable insights, but they may be subjective and influenced by personal biases. No method guarantees perfect accuracy. For example, the 2020-2022 semiconductor shortage significantly impacted new car production, which, in turn, had a ripple effect on used car values, demonstrating how unforeseen events can render even sophisticated models inaccurate.
Examples of Successful and Unsuccessful Predictions
Numerous examples exist of successful and unsuccessful used car price predictions. Successful predictions often involve meticulous analysis of historical data, robust modeling techniques, and a deep understanding of the market’s nuances. Unsuccessful predictions may stem from flawed models, inadequate data, or unforeseen external shocks. Unfortunately, precise examples of specific models and their outcomes are not publicly available, as proprietary methods are often used.
A Simple Forecast Model
A rudimentary forecast model for used car prices could utilize a weighted average of several key indicators. For instance, a model might assign weights to the following factors:
- Current market supply and demand (40%): This can be determined by comparing the number of vehicles available for sale to the number of buyers actively searching for vehicles.
- Average vehicle age (30%): Older vehicles typically command lower prices. This component would account for the depreciation of used vehicles.
- Economic indicators (20%): Inflation and interest rates are significant factors that influence purchasing power and the overall market.
Each factor’s weighted value is added to arrive at a predicted price range. This simple model is just a starting point and could be significantly enhanced by incorporating more factors and advanced statistical techniques.
Addressing Data Limitations and Biases
Accurate analysis of used car prices hinges on reliable data. However, various limitations and biases can affect the precision of this data, potentially skewing the overall conclusions. Recognizing and mitigating these factors is crucial for producing a comprehensive and trustworthy analysis.
Understanding the inherent limitations and biases in the data allows for a more nuanced interpretation of the results. By acknowledging these factors, we can better account for their influence on the analysis, and ultimately, generate more robust and reliable insights into the used car market.
Potential Data Limitations
Data collection for used car prices is complex and often incomplete. Information gaps can stem from several sources. Inaccurate or incomplete odometer readings, missing service records, or inconsistent reporting methods across different sales platforms are all potential contributors to the problem. This lack of comprehensive and consistent data can hinder the ability to create a precise model of used car pricing trends. Moreover, the sheer volume of transactions in the used car market can make it challenging to capture and aggregate all the necessary information.
Biases Affecting Price Data Accuracy
Various biases can skew the accuracy of used car price data. One major source of bias is the inherent selection bias in the data. If a particular dataset predominantly features high-end vehicles, the average price will likely be inflated, misrepresenting the overall market trends. Similarly, data collected from specific regions or dealers may not be representative of the entire used car market. Moreover, the subjectivity involved in assessing vehicle condition and mileage could lead to inaccuracies in reported prices.
Mitigation Strategies
Several strategies can be employed to minimize the impact of these limitations and biases. One approach is to employ robust data cleaning procedures, which include identifying and correcting discrepancies, filling in missing values using imputation techniques, and standardizing data entry formats. Another crucial step is to ensure data representativeness by employing diverse sampling methods. For instance, using a stratified sampling approach that ensures proportionate representation of various vehicle models, years, and conditions can significantly enhance the reliability of the analysis.
Verifying Data Accuracy
Verifying the accuracy of used car price data involves multiple steps. One method is to cross-reference data from various sources, including online marketplaces, dealer inventories, and auction records. This cross-referencing can help identify discrepancies and potential errors. Further, comparing the average prices from different sources to established market benchmarks, such as Kelley Blue Book (KBB) values, can provide a robust validation method. Consistency and reliability of these benchmarks should be carefully evaluated.
Impact of Data Sources
The choice of data sources significantly influences the overall analysis. Using exclusively online marketplace data may overlook the influence of private sales and auctions, potentially leading to an incomplete picture of the market. Similarly, relying solely on dealer inventories might bias the analysis toward specific brands or models that dealers frequently stock. A balanced approach that incorporates multiple data sources is necessary to gain a comprehensive understanding of used car prices. Using a combination of publicly available data and specialized market reports will provide a more balanced view of the used car market. Analyzing the characteristics of each data source (e.g., online marketplace data, dealer inventories, auction records) is essential to understand its limitations and biases and to assess its suitability for the specific analysis.